Findings Guide
PST 315: Methods of Policy Analysis and Presentation
Each finding and the accompanying graph, source, and comment will have its own page in the report.
General layout of a findings page
- Finding statement
- Graph
- Source
- Comment (if needed)
- Page break
Finding statement
- Your first finding statement will go two lines below the “FINDINGS” header.
- Your finding statement should be numbered (for example, your fourth finding will start “4.”).
- Do not include an indent anywhere in the finding statement.
- Do not include (n=) at the end of your finding statement in the Findings section. This is because (n=) should be included in your graph.
- Note: you will include (n=) following your findings in the Executive Summary.
- See class slides for how to write finding statements.
Graph
- You will copy and paste your graph below your finding statement.
- Graphs should be made in Excel.
- Follow the PST 315 Graphing Guidelines!
- Your graph should be centered on the page.
- Do not insert a screenshot of your graph.
Source
Below your graph you will type the source of your graph directly into the Word document. The source should read something along the lines of: “Data collected by John Doe and analyzed by Jane Doe for XYZ Organization, Community Link Project, November 2025.”
Comment
Some graphs will require a comment typed into Word below the source. This includes aggregated graphs, open-ended response graphs, graphs where the percentages do not add up to 100%, and graphs where you group multiple responses into one category (including “other” categories).
Page break
To insert a new page, add a page break. Do not add a section break. Use Insert → Page Break, and begin your next finding at the start of the next page.
Example findings page
This example uses sample data. Skills Win Coaching Organization is a real Syracuse University program, but the numbers shown are invented for teaching purposes and are not actual SWCO results.
The whole page – statement, graph, source, and comment – looks like this:
- 34% of respondents said more activities would improve the site sessions.
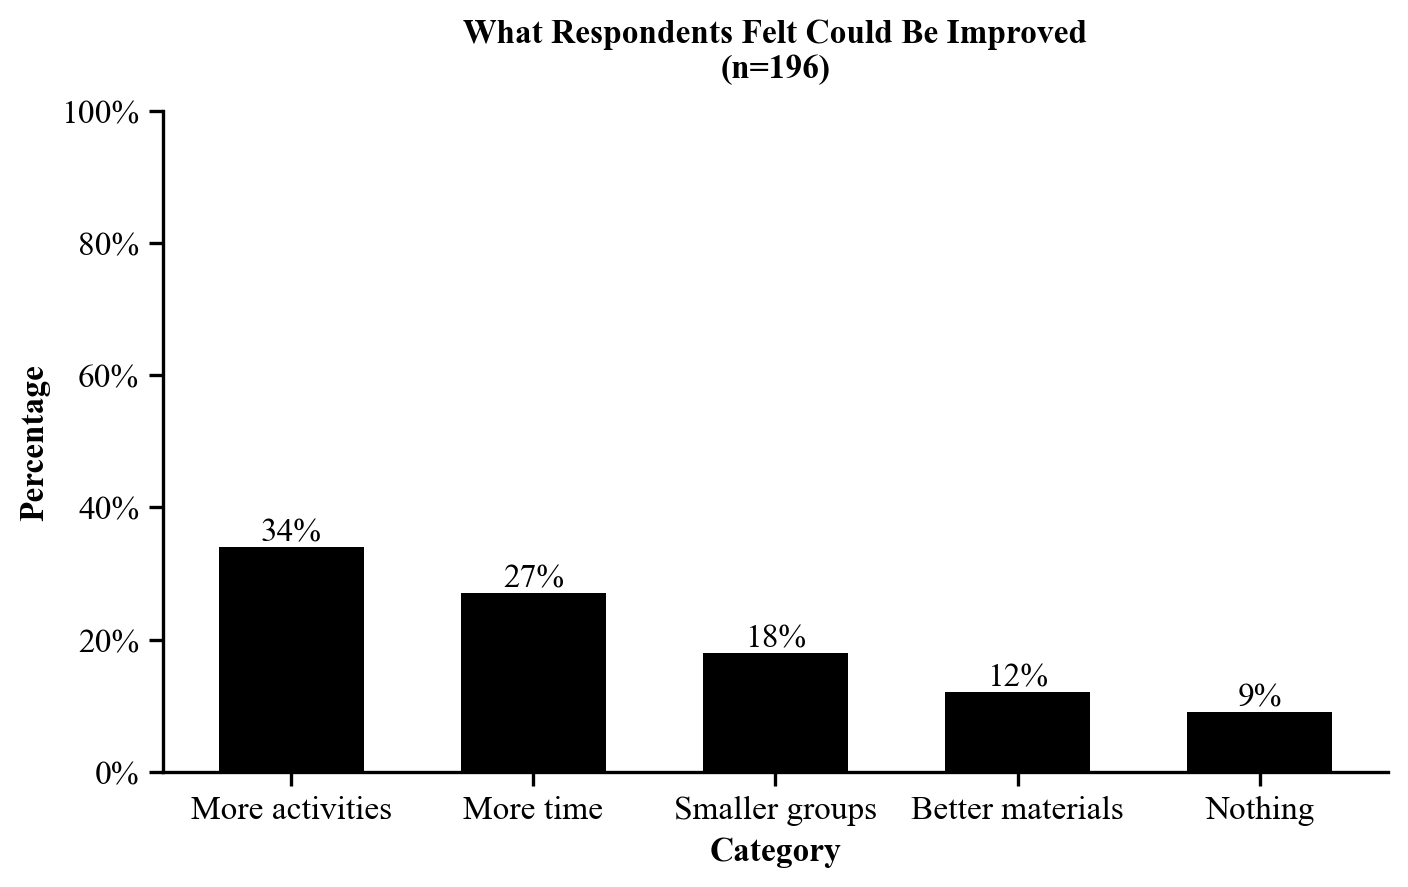
Source: Sample data collected and analyzed by Jordan Alvarez for the Skills Win Coaching Organization, Community Link Project, November 2026.
Comment: Respondents could give only one answer, so percentages total 100%. Responses that named a specific activity were grouped into “More activities.”