Introduction and Methods Guide
PST 315: Methods of Policy Analysis and Presentation
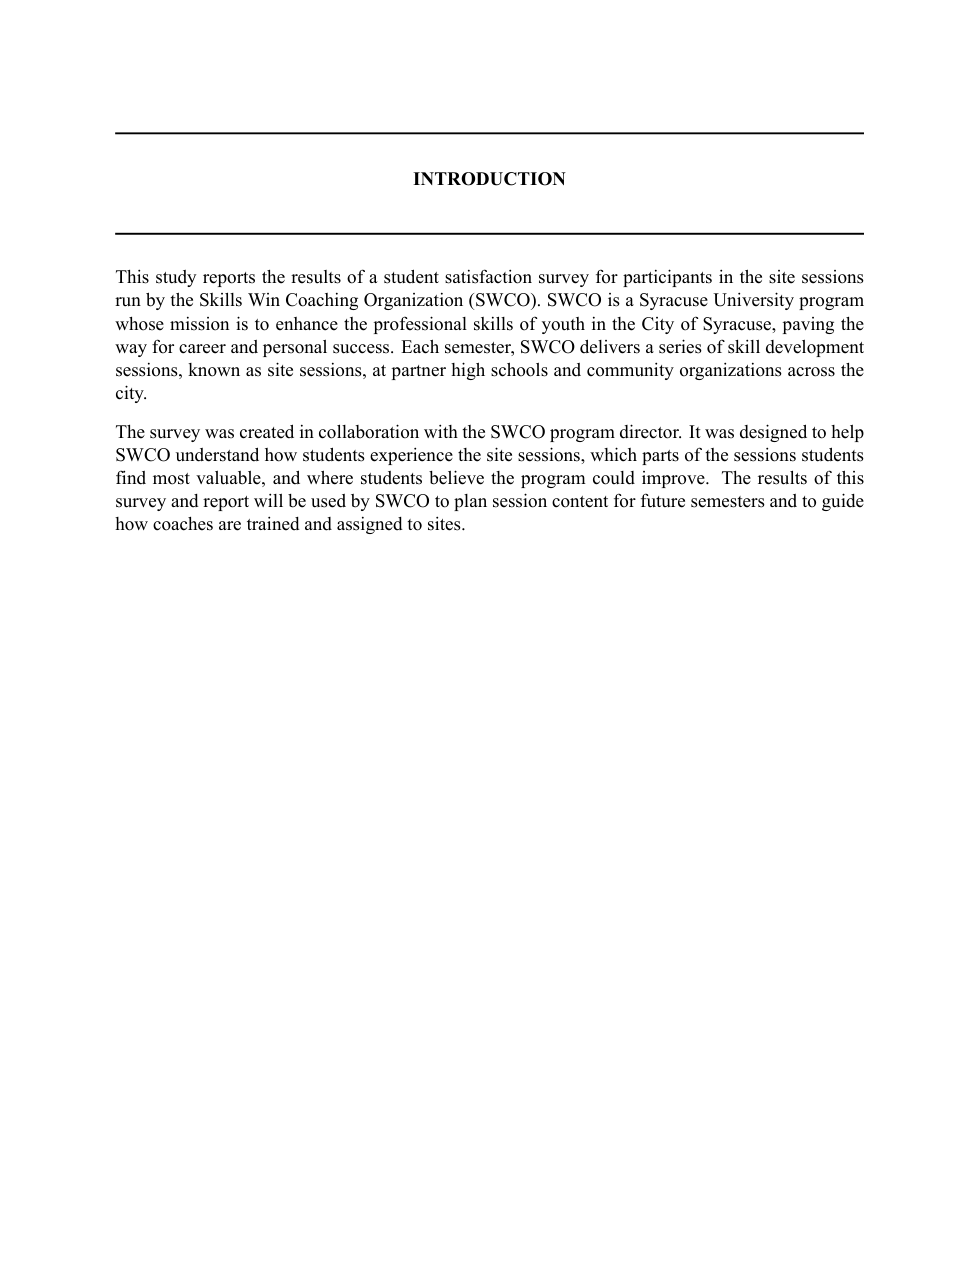
Your Introduction is where you will provide more details about your client’s organization and how your report will support their agency and mission. The first sentence in your Introduction section should be identical to the first sentence in your Executive Summary.
Within your Introduction section, you should include information about your client’s organization from the Organizational Assessment. This can include the agency mission, services they provide in the community, or any other relevant information about who they are as an organization. Then you should explain in a few sentences what your report will be used for.
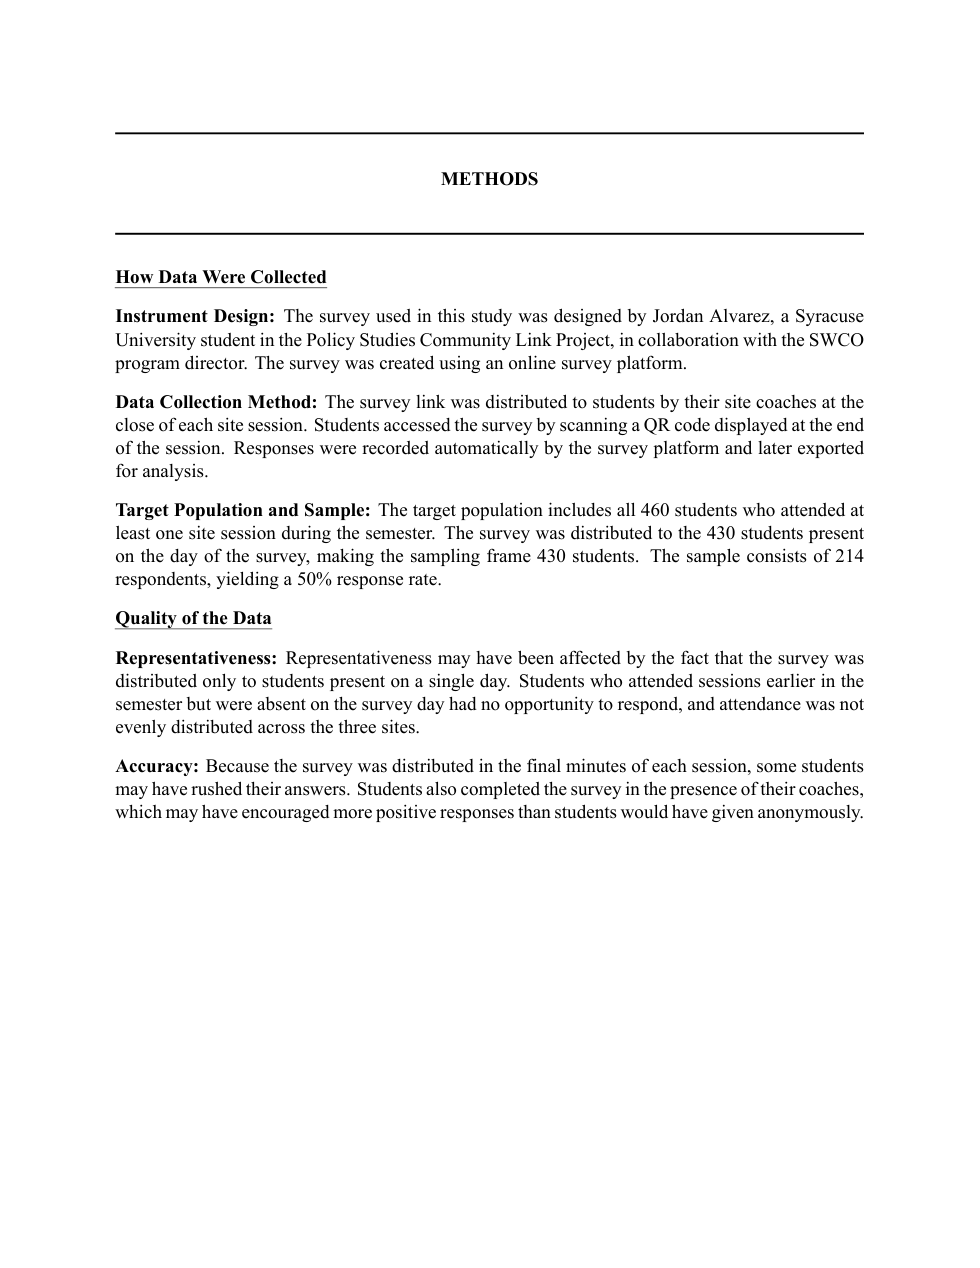
Your Methods section will be made up of two main parts: how data were collected, and quality of the data. Within each part, there will be subsections covering different topics important for your client and reader to understand about the data.
How data were collected
Instrument design. This section is where you will explain how the survey or data was created. In this section, you will include details of who helped in the creation of the survey or data as well as any platforms used to facilitate the survey or data (for example, Google Forms).
Data collection method. This section provides information about timing of the survey (open date, close date, any reminders), who sent out the survey, and how and who recorded results. For data projects, this section will provide information about how your client collected this data, when the data was collected, and how you recorded the data.
Target population and sample. This section will include exact numbers (if possible) for your target population, sampling frame, and sample. Additionally, if applicable, record a response rate here.
Quality of the data
Representativeness. This section will explain any threats your project experienced with representativeness. As a reminder, when thinking about representativeness, ask yourself: “How well does the sample reflect the target population?” Some (but not all) potential threats to representativeness could be a small sample, selection bias, or non-random selection.
Accuracy. This section will describe any potential accuracy threats your project experienced. As a reminder, when thinking about accuracy, ask yourself: “Does the data reflect reality?” You can never be certain your data is 100% accurate. Some potential accuracy threats to survey projects are respondents having motivated bias, respondents not understanding questions or unclear questions, or mistakes in transferring and recording data. Some potential accuracy threats to data projects are mistakes in recording, incomplete or messy records, and biased record keepers.
The example pages below use sample data. Skills Win Coaching Organization is a real Syracuse University program, but the project, author, and numbers shown are invented for teaching purposes and are not actual SWCO results.
Example introduction page
Example methods page